How to Calculate Customer Lifetime Value From Your Own Orders
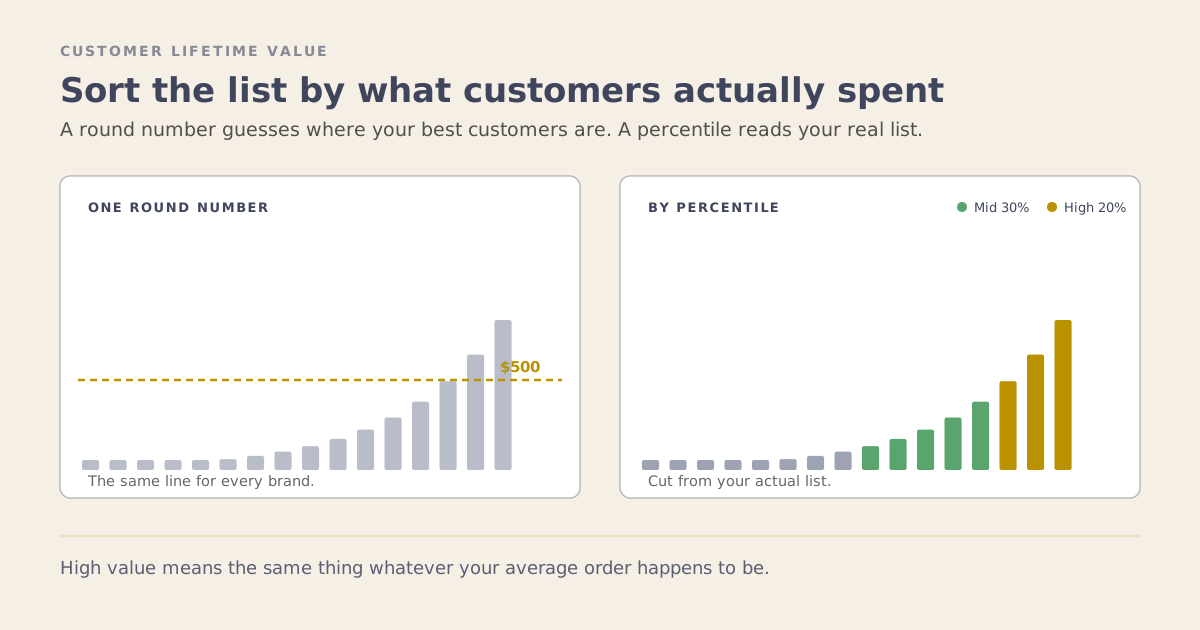
Most Klaviyo accounts I open have a segment called VIP, and its definition is “spent over $500.” A single number, picked once, probably years ago. It files a customer who spent $520 across 2 years into the same group as one who spent $12,000, and it leaves out a loyal buyer sitting at $480. The threshold was a guess, and the list has been sorted by that guess ever since.
Customer lifetime value replaces the guess with your own numbers. It used to be a spreadsheet job. Now, if your store is connected to Claude, it is a question you ask in plain English.
What Customer Lifetime Value Is
Historic CLV is what a customer has actually spent with you. Add up their orders over a window of time, and that total is the number. I use a trailing 24 months as the default, because it reflects who a customer is now rather than who they were 5 years ago. All-time spend is the other option, and it suits brands with a long repeat cycle, where a purchase every 18 months is normal.
Klaviyo already shows a Historic Customer Lifetime Value on every profile, though that figure is all-time. A 24-month window, or any window that matches how your customers actually buy, is the kind of thing people used to build a spreadsheet for. That is the part that just got easy.
The Easy Way: Ask Claude to Do It
If your Klaviyo or Shopify account is connected to Claude through its connector, a plug-in that lets Claude read your account once you give it permission, you can ask for the whole thing in plain English and get segments back.
The request is roughly this: “Look at the last 24 months of orders, work out each customer’s total spend, and split the list into high, mid and low tiers by percentile. Build them as segments.” Here is what that does, step by step.
- It reads your order history. Claude pulls each customer’s orders from the last 24 months and adds up what they actually spent. This is the windowed number Klaviyo does not show you on its own.
- It ranks the list and finds the cutoffs. It sorts everyone by that 24-month total and works out the dollar line for the top 20%, the next 30%, and the rest. Those lines land in a different place for every brand, which is the whole point.
- It builds the segments. Claude creates the 3 tiers in Klaviyo at those thresholds, so High Value, Mid Value and Low Value show up in your account ready to send to.
- They stay live. Because each tier is a Klaviyo segment with a spend condition, customers move between tiers on their own as they keep buying. You calculate once, and the groups stay current.
The whole thing takes one request and a minute of reading back what it built. The arithmetic that used to sit in a spreadsheet now sits in your account as 3 working segments.
Prefer to Do It by Hand
The math is simple enough to do yourself. In Shopify, each customer record carries total spent and order count, and a customer export gives you every buyer with their lifetime total in a column. Filter to the last 24 months, sort by spend, and mark the top 20% as high, the next 30% as mid, and the rest as low. Then recreate those 3 groups in Klaviyo as segments with a spend threshold.
Same result, by hand. And it shows why a round number like “spent over $500” falls short: a $500 line might catch the top few percent of one brand’s customers and nearly half of another’s, so the same rule means something different in every account. A percentile reads your actual list, so “high value” means the same thing, the top slice of your customers, whatever your average order value happens to be.
What Each Tier Gets
The reason to tier at all is that each group earns a different email.
- High tier. Your revenue lives here, so protect it. Early access, the first look at a new product, the occasional genuine thank-you. These customers buy at full price, and a blanket discount trains your most valuable people to wait for one.
- Mid tier. The group with the most room to move. A well-timed cross-sell, or a nudge toward the product that turns a 2-time buyer into a regular, does more here than almost anywhere else.
- Low tier. One-time and lapsed buyers. This is where a reactivation offer or a winback flow earns its place, and where a discount does the least damage, because there is no full-price habit to protect.
That last point opens a harder question: who should get your Black Friday discount, and who should not. That one is worth a post of its own.
Historic CLV or Predicted CLV
Historic CLV is what happened. Predicted CLV is Klaviyo’s forecast of what comes next. They answer different questions, and both earn their keep.
Build your tiers on historic, because it is real and stable. Use predicted as an early signal: a brand-new customer with 1 order and a high predicted value is someone to move into a nurture path before their spend has caught up. Historic tells you who your best customers are. Predicted points at who they are about to become.
Before You Build It
Two checks first.
Does the tiering change what you send? If the high, mid and low groups all receive the same campaign, the tiers are decoration. The value shows up only when each group is treated differently.
Is 24 months the right window for your cycle? A brand people buy from monthly and a brand people buy from once a year want different windows. Start at 24 months and adjust to your own repeat rhythm.
Once the list is tiered, a lot of the retention calendar writes itself: who gets the early access, who gets the cross-sell, who gets the winback. The arithmetic was never the hard part. Deciding to treat your customers by what they are actually worth to you is.
If you want help turning your order history into segments you can actually send to, book a strategy session.